


Best Subset Selection Output
Here, we will show the output from the model we used to illustrate running Best Subset regression analysis on the "Perform" page. The general overview of aspatial regression output also applies to Best Subset regression, and descriptions of output from "full model" runs of linear, logistic, and Poisson aspatial regression will also be important pages to review when you run Best Subset model selection tools.
Summary of the model run
After clicking to the run method page and then selecting "Run", we see the following output in the log view, beginning with the summary of the model run.

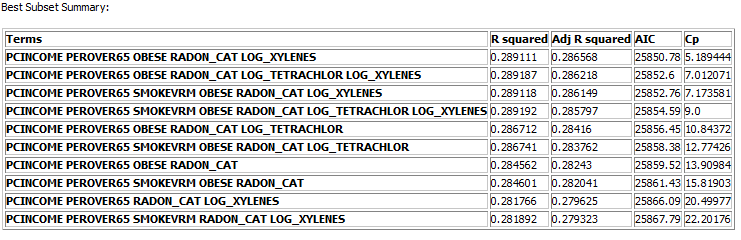
Best subset summary
The first output table from the Best Subset tool provides the top ten models as ordered by the selection criterion that you selected on the model settings page of the regression dialog. In this example we chose AIC, and the top model listed has the lowest value. This model is the same one selected (from the same suite of datasets) by the forward stepwise and backward selection methods. To review all of the selection criteria for the various model types, click here. Using the Best Subset tool, you can see that there are only slight variations among models that share the key variables (PCINCOME, and to a lesser extent PEROVER65, and RADON_CAT); these top models include various subsets of the other four variables. This approach gives a more nuanced view of the data than did the stepwise procedures, as you can see that two variables that those tools did not include (LOG-TETRACHLOR and SMOKEVR) are each components of models in the top 3 (see below).
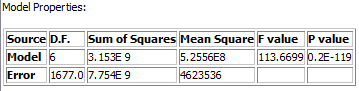
The next table (shown below) describes the properties of the "best" model, and this model is the one for which the three output datasets appear in the Data view (in an output folder below the response variable, RWM_LUNG).
Significance of individual model parameters
The next table in the output for Best Subset regression provides the parameter estimates, standard errors, and P-values for each parameter in the model. See the implementation page for the particular form of regression that you used (linear, logistic, and Poisson) for a description of how the p-values are derived. Recall that significance values in regression output are reported as "0.0" if they are smaller than 0.000001, and, as described on the categorical variables page, a parameter is estimated for each level of a categorical variable, except for the level that is chosen as the reference value (we chose the radon category "2").

To compare this output to output from the Stepwise approaches, click here for Forward, and here for Backward Stepwise.