Aspatial Poisson Regression Output
SpaceStat output from Poisson regression includes calculation of model deviance, which measures the fit of the model as a whole, and p-values for the whole model, and p-values for individual terms in the model.
Here, we will show the output from a model similar to the one used to illustrate running a regression model on the "Perform" page of the help. However, as described in the "About" page for Poisson regression, we will now use a Poisson distribution to fit our model, so we want to apply the model to a dataset that comes close to meeting the assumption of having equal mean and variance. So, in this case an unsmoothed set of cervix cancer risk data (CERVIX) was used instead of the smoothed set shown on the "Perform" page (CERVIX-RIS). Otherwise, the "Regression Model" and "Define Model" pages for Aspatial regression within the Task manager would look the same as the example, although we changed the name of the model to "CERVIX CANCER - POISSON. Next, on the settings page, we chose "Poisson" as our model type rather than "linear". The only other change in how we performed the Poisson regression is that we added the word "Poisson" to the output folder to help us differentiate our output files from those produced with the other model types.
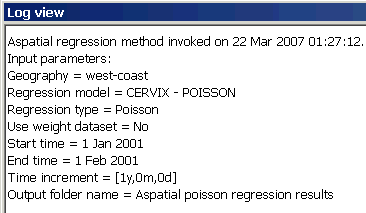
Summary of the model run
After clicking to the run method page and then selecting "Run", we see the following output in the log view, beginning with the summary of the model run.

Fit and significance of the model as a whole
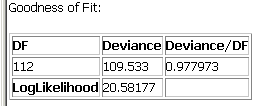
Below the review of the model run information, SpaceStat presents information on the model fit, and the model Log Likelihood value, for the first time period. The dataset described here only includes one time period, but if you analyzed a set with several time intervals, you would see output for each period.
As described in the "Implementation" page for Poisson regression, to evaluate the significance of the full Poisson regression model, SpaceStat presents the difference (deviance) between the log-likelihood of the full model and that of a "perfectly–fitted" model in which the Poisson mean at each observation is set equal to the observed value. The deviance is divided by the number of degrees of freedom and this quotient is then compared with unity (1) to judge the goodness of fit. (Recall that in a Poisson distribution, the mean and the variance are equal, implying that the deviance/DF should also be about 1).

Here, the Deviance/DF is quite close to one, suggesting that it is appropriate to try to fit a Poisson model to this dependent variable.
Significance of individual model parameters
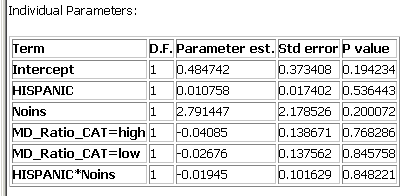
The next table in the output for aspatial Poisson regression provides the parameter estimates, standard errors, and p-values for each parameter in the model. See the implementation page for a description of how the p-values are derived. Note that as described in the page on categorical variables in regression, a parameter is estimated for each level of a categorical variable, except for the level that is chosen as the reference value.

In contrast to what we found using a linear model with smoothed cervix cancer rates (see results here), not one of the parameters in our model, including the intercept, was significant (all p-values were greater than 0.19). This suggests we need to start looking for some different independent variables to include in our model, or that we should stick with the smoothed data, for which a linear model was more appropriate.
Table of correlation coefficients
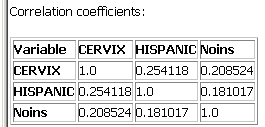
Finally, as with the other two methods, the last table produced as part of the output for aspatial Poisson regression shows the correlation coefficient for each pair of numeric variables in your model. This is helpful for understanding how different independent variables are related, and can be used to identify terms that could be dropped from the model due to high correlation with other terms.

Here you can see that the correlations between our two continuous variables and the dependent variable (CERVIX) are quite a bit lower than they were with the smoothed version of the same dataset (CERVIX-RIS) that we found in the linear regression output. This is an example of the deleterious effect of the "small numbers problem," which is described further in the small numbers tutorial. As before, the correlation between HISPANIC and Noins is not high enough to prompt concern about colinearity.
Note that these values may differ from correlation coefficients presented in the graph statistics window due to the effect of missing values. In the case of the regression model, the correlation will not include data from ANY of the variables at observations where one or more value is missing, while only missing values in the two datasets being compared will influence the correlation coefficient in the graph statistics window in a scatter plot.


