


Overview of Aspatial Regression Output
When you run an aspatial regression model, SpaceStat will produce output that will appear in two different locations; a summary of your model and the tables of statistics produced in the analyses will appear in the log view, while new datasets will be sent to the data view. This basic overview of regression applies whether you choose the "Full model" option, or choose to do exploratory model building with one of the model selection tools.
Evaluation of your model and the individual parameters
Information about the model fit, the importance of various regression coefficients, and their associated standard errors and p-values, are presented in tables in the log view. Also, SpaceStat reports a table of correlation coefficients that describes the correlation between individual terms (numeric datasets) in the regression model. Note that significance values in regression output are reported as "0.0" if they are smaller than 0.000001. There are some variations in the output presented for the various model types; pick one of the following links to see example output for linear, Poisson, and logistic models, respectively.
The aspatial regression results folder
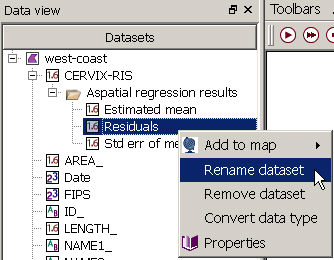
The data view lists three datasets that are created for each regression model run: "Estimated mean", "Residuals", and "Std err of mean", an abbreviation for the standard error of the mean. As shown below, these datasets will appear in a folder with the default title of "Aspatial regression results" that will be shown under the dependent variable for your regression model. These datasets will also appear if you open the data table for your geography.
If you right click on any dataset, you can: Add it to a new or existing map, rename or remove it, convert it to a different type (e.g., from a decimal to a string dataset), or view it's properties. Specifically, the properties for datasets created by regression analyses repeat the information that appears in the run method window when you perform the analysis. You will likely find the scatterplot, histogram, and box plot to be useful tools for examining your output datasets. The R-squared and significance values listed in the log view provide information on the explanatory power of the independent variables included in your model, and the characteristics (i.e., parsimony) of the regression model. How models and individual parameters of models are evaluated are described in more detail in the "Implementation" pages of each regression model form (linear, Poisson, and logistic).
Note, however, that if you use the scatterplot and look at the correlation coefficients shown in the statistics window, the values may differ slightly from what was given in the regression output that appeared in your log view; this difference (when it occurs) is due to a differences in how missing values are treated (see here for more details).