Also called lattice wombling, raster wombling operates on numeric raster (i.e., lattice or gridded) data. Boundaries are determined through applying Boundary Likelihood Value (BLV) thresholds and subboundary connections are made through gradient angle thresholds.
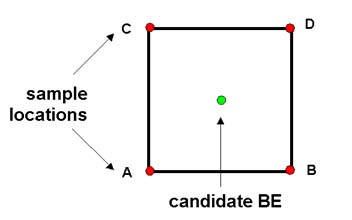
In raster wombling, the BLVs are calculated from a 2x2 kernel. Kernel functions are like roving windows that expose pixels of a raster. This method assumes that pixel size is the same in the X and Y directions. Each set of four locations {A, B, C, D} form a unit square (see figure below).
Coordinates are transformed so that A is at an artificial origin. A surface is fitted to the square (equation 1 below). The gradient for the surface is estimated for each BE (point q in equation 2, where i and j are unit vectors in the x and y directions). Then, the gradient magnitude for each variable is estimated ("m" in equation 3). BoundarySeer averages each variable's gradient magnitude for the BLV. BoundarySeer also calculates the gradient angle for use in constructing subboundaries (equation 4).
![]() (1)
(1)
![]() (2)
(2)
![]() (3)
(3)
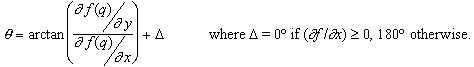 (4)
(4)
This method assumes that the pixels are square. If you georeference a raster by entering the raster data boundaries, it is possible to get pixels that are not square and thereby introduce error into the gradient estimates.
Barbujani et al. (1990) used lattice wombling on eight unlinked polymorphic red blood cell markers to identify genetic boundaries in Eurasian human populations. The boundaries were explained by different processes restricting gene flow; some boundaries corresponded to physical barriers such as mountains, while others overlay linguistic barriers between cultures that restrict exogamy. Bocquet-Appel and Bacro (1994) applied the multivariate approach to simulated surfaces describing correlated and uncorrelated variables corresponding to genetic, morphometric and physiologic characteristics, and found that it correctly detected the locations of simulated transition zones. Fortin (1997) delineated boundaries with this approach for three data sets, tree and shrub density, percent coverage, and species presence-absence, all of which are related to specific vegetation zones.
See also: