Within BoundarySeer, you may set wombling thresholds based on a priori cutoffs (say the upper 5% or 10% of all Boundary Likelihood Values), or you may choose thresholds based on the distribution of BLVs in the data set itself, using a histogram. To define thresholds using the histogram of BLVs, follow these steps.
Begin detecting a boundary by wombling according to the general instructions. (See How to womble)
On the "Thresholds" tab, choose to set thresholds using "a histogram of boundary likelihood values." Click "OK."
If you checked the standardize data box on the "General" tab, you will be prompted to standardize your data and you may save the standardized data set under a new name.
The "define threshold using histogram" dialog will begin, and a histogram of the BLVs for your data set will appear.
Choose the type of boundary: crisp or fuzzy. Skip ahead to the instructions for fuzzy boundaries.
For crisp boundary delineation:
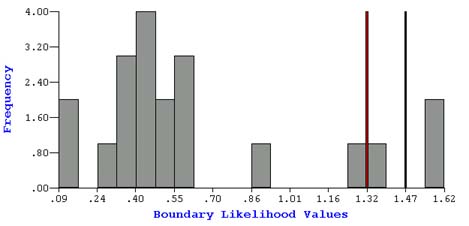
Choose the cutoff for Boundary Elements (BEs). BoundarySeer will display a histogram of BLVs, with a default cutoff value chosen (see illustration for fuzzy example below). The chosen value will appear in the dialog box and the value will appear as a red line on the histogram. You can accept the cutoff value or change it based on viewing the histogram.
To change the threshold, enter a new BLV cutoff in the white box.
Hit "Apply" at the bottom of the tab to see the new cutoff on the histogram. BoundarySeer will display the equivalent percentage threshold in the gray box below the BLV threshold.
Hit the "Gradient Angle Thresholds" button to change the default settings. Gradient angle thresholds only apply to numeric raster and point data. The button will be grayed out for other data types.
Once you are satisfied with the cutoffs, click "OK" to accept them.
For fuzzy boundary delineation, you need to choose the value for the boundary and the boundary core. The boundary core cutoff appears in black, while the boundary cutoff appears in red (see above).
To change either threshold, enter a new cutoff BLV value.
Hit "Apply" to view the changes on the histogram, and then "OK" to accept them.
A dialog will ask you if you would like to view the boundary. You may choose to view the boundary in a new or an existing map.
Next Step:
See also: