The map shows the locations of Boundary Elements, the locations of greatest spatial change in the territory abundances of all 6 warbler species.
![]() Zoom in on an area of the map where you see green circles using the zoom tool from the map toolbar.
Zoom in on an area of the map where you see green circles using the zoom tool from the map toolbar.
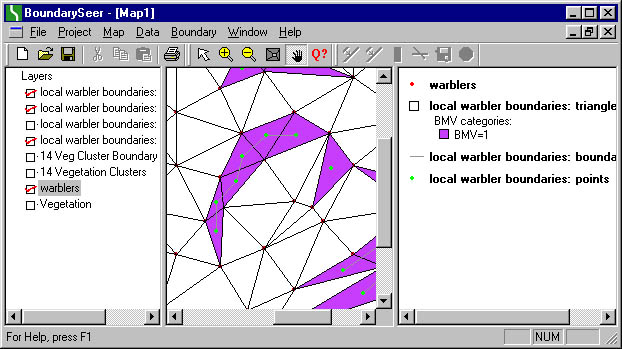
You will see Boundary Elements illustrated in a few different ways, as points, triangles, and links (see layer list below). Some of this information is redundant: boundary triangles and boundary points show the same information in different ways (you can see all purple triangles (boundary triangles) hold a green dot (boundary points)). You can view the boundary likelihood values as well.
You can view, customize, and query this map as you would any BoundarySeer map.
You can get an even closer look at the data in a table.
"local warbler boundaries: points" is a point layer showing the locations of Boundary Elements (BEs, locations where Boundary Membership Value (BMV) = 1).
"local warbler boundaries: triangles" is a polygon layer showing the Delaunay triangulation, the nearest neighbor network used in wombling on point data. Delaunay triangles with BMV = 1 appear in color.
"local warbler boundaries: boundary links" is a line layer showing the subboundary connections between adjacent boundary elements. Elements are linked if they meet the gradient angle criteria you specified in the wombling dialog.
"local warbler boundaries: B.L.V." is a layer showing the BLVs of all candidate BEs. For numeric data, it is a polygon layer similar to "Boundary: triangles" but illustrating BLV rather than BMV.
![]()