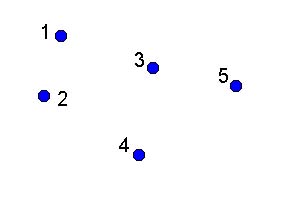
Suppose we have a very simple data set (illustrated below) consisting of 5 point locations, and 3 variables. The vector of observations (the list of the values of each variable) for location i is Zi = (zi1, zi2, zi3). We have detected boundaries for this data set, and we are in the process of evaluating overlap statistics for these boundaries and a set of boundaries from a different data set.
Assume that the generator matrix has been calculated for this data set from a distance decay function, and looks like

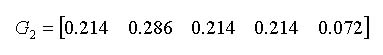
Now we will explain what happens during a single Monte Carlo randomization. We choose an observation vector at random, say Z2. We will decide which location to assign this vector to by focusing on row 2 of the generator matrix, which gives the relative probabilities for assigning Z2 to the 5 locations. We calculate the actual assignment probabilities by dividing each element in row 2 by the row sum. These probabilities are:
We then select a location at random according to these probabilities. Suppose location 3 is chosen. We then assign Z2 to location 3.
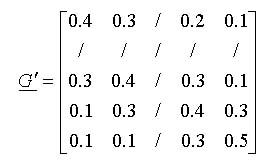
Before proceeding, let's adjust the generator matrix to account for the fact that Z2 and location 3 are no longer available for assignment. We do this by removing row 2 and column 3. The adjusted generator matrix is:
We then proceed as before until all observations are assigned to locations. BoundarySeer then detects boundaries for the resulting randomized data set and recalculates the test statistic
See also: