The upper and lower p-values provide a sense of how extreme the value is compared to the distribution. The histogram below shows a distribution of 1000 randomly generated numbers. The red lines approximately showing the top and bottom 5% of the distribution. Thus, they delineate the cutoff values for alpha = 0.05.
BoundarySeer calculates the upper and lower p-values for the observed value of the test statistics using the following formulae:
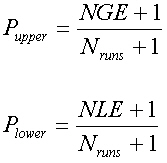
where Nruns is the total number of Monte Carlo simulations, NGE is the number of simulations for which the statistic was greater than or equal to the observed statistic, and NLE is the number of simulations for which the statistic was less than or equal to the observed value. One (1) is added to the numerator and denominator of each because the observed statistic is included in the reference distribution.
See also: