The interpretation of the likelihood of a test statistic must balance the likelihood of an error of type 1, rejecting the null hypothesis when it is true, and the likelihood of a type 2 error, accepting the null hypothesis when it is false. The likelihood of a type 1 error is the alpha ( ![]() ) level. Comparing the test statistic to the expected distribution provides a p-value for the observed value, short for probability value. If the p value for the observed value falls below alpha, then the observation is termed significant.
) level. Comparing the test statistic to the expected distribution provides a p-value for the observed value, short for probability value. If the p value for the observed value falls below alpha, then the observation is termed significant.
P = 0.05 is the traditional alpha level, which can be interpreted to mean that results that or more extreme would occur by chance less than 5% of the time, if the null hypothesis were true. When probability of the null hypothesis generating the pattern is less than the alpha level, it is customary to reject the null hypothesis and accept an alternative hypothesis.
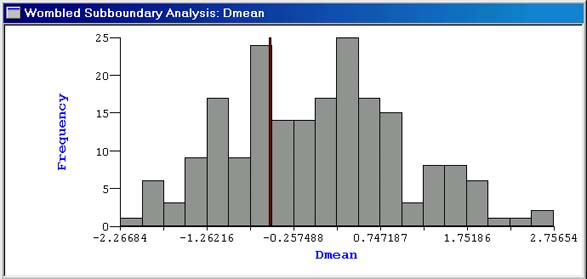
The figure below shows a reference distribution created for the mean subboundary diameter (Dmean) in a subboundary analysis. The red line on the graph shows the observed value for Dmean, and the gray bars show the reference distribution created from 200 randomizations. In this case, the observed value is not statistically unusual, being neither remarkably large (p = 0.711), nor remarkably small (p = 0.348).
The probability of a type two error is beta ![]() , and the power of a statistical test to reject a null hypothesis is 1 -
, and the power of a statistical test to reject a null hypothesis is 1 - ![]() .
.
See also: