Interpreting location uncertainty rasters
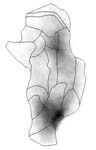 BoundarySeer produces a monochrome raster image of the boundaries accounting for location uncertainty (see figure at left). The boundary will appear fuzzy or graded, which illustrates the location uncertainty in the data and therefore in the resulting boundary.
You may change the settings on the raster (see formatting rasters), but the default settings are that dark areas represent raster pixels with higher boundary membership values (BMVs). See the method description for more detail. The resolution of the raster depends on the value entered in the dialog box (# of columns in the resulting raster).
Raster data files are often too large and complex for viewing easily in a table. For this reason, we have restricted raster boundary visualization to maps and map queries. For location uncertainty rasters, you may view a table of the queried coordinates, the row and column you've queried from the raster, the coordinates of the pixel center, the BMV, BLV, and the number of "hits" (times the area was part of a boundary triangle).
See also: