Accounting for location uncertainty in statistical analyses improves spatial pattern detection and interpretation (Jacquez and Jacquez 1999). To this end, BoundarySeer can use spatial randomization models to propagate the location uncertainty in wombling boundaries. This occurs through a process of repeatedly randomizing the spatial locations of the data within a user-set location model, recalculating the boundaries for each randomization, and then producing a raster displaying the relative boundary memberships for individual pixels in the raster.
The user specifies the data sets for the analysis: 1) a polygon data set or 2) a point data set with an associated polygon data set. For the point set, the polygons bound the area within which BoundarySeer randomizes the points. This procedure requires non-overlapping polygons. (If polygons overlap, a point may belong to two or more polygons, which may invalidate this method.)
BoundarySeer creates a sampling grid or raster that covers the data set. The dimensions of the raster can be set in the "Location uncertainty" dialog box (# columns in resulting raster).
BoundarySeer randomly chooses a point within the polygon and assigns the data to that point. Currently, BoundarySeer chooses from a uniform distribution within the polygon. In future versions, BoundarySeer will allow more complex location models.
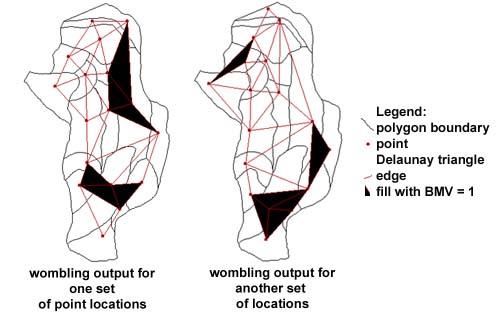
BoundarySeer follows the steps of crisp irregular (point) wombling: first drawing the Delaunay triangulation (in red below) between nearest neighbor points, then calculating boundary likelihood values (BLVs) and boundary membership values (BMVs). The BMVs are associated with the triangles (as shown in the "Boundary: triangles" layer in point wombling maps). In the figure below, triangles with BMV = 1 are black.
BoundarySeer repeats steps 3 and 4, keeping track of the number of times a pixel in the raster includes a boundary triangle (i.e. one with BMV = 1).
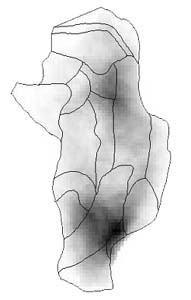
From a number of iterations of crisp wombling on different randomizations of the data locations, BoundarySeer creates a fuzzy summary raster (see below). Essentially, the BMV for each pixel is the number of times the pixel was part of a boundary triangle, divided by the total number of iterations. Compare the output below with two of the iterations (shown above).
Next Step: