


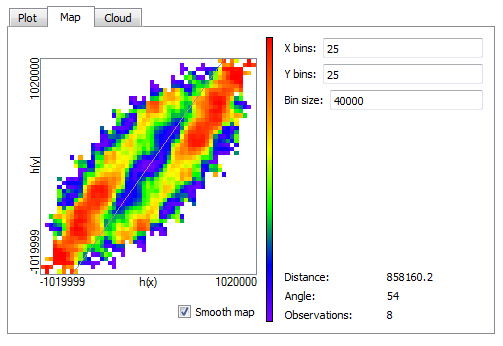
Compute variogram map
Left click the 'Map' Tab to view the panel for the variogram map.
Select the number and width of cells to compute the variogram map (e.g. 25 cells of 40 km). The rotating vector allows the user to identify the direction of maximum continuity (i.e. smaller variability). The corresponding angle is displayed at the bottom right.
The option 'smooth map' filters some of the noise in the variogram map and can facilitate the identification of the anisotropy.
Undock the Map window by dragging out the 'Map' Tab. Close the window to dock it back.