


Create a Map
-
Click on "View>
 Map,"
or click on the Map icon
on the visualization toolbar,
Map,"
or click on the Map icon
on the visualization toolbar, -
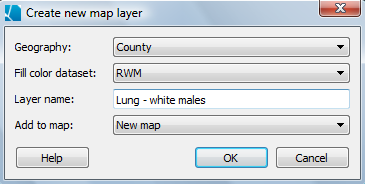
Then, select the geography that you want to see on the map.
-
Select the dataset you want to use to determine the fill color,
-
<optional> Change the name of the new layer - the default name will be the same as the geography, but here we have changed the name to match the variable (lung cancer rate for white males, abbreviated as RWM).
-
The last section of the dialog box asks if you want to create a new map, or add a new layer to an existing map. If you choose to add to an existing map, you can scroll through other maps in your project by clicking on the down arrow for this box.
Express Option
Alternatively, you can right-click on any geography or dataset and choose "Add to Map" from the pop-up menu. You can then choose to display this information in new map, or to add it to an existing map.