


Time Plot Properties
Once you have created a time plot, you can customize its look by choosing "Properties" from the "Graph" menu. You can specify the some general features, change the labels, and modify the bounds.
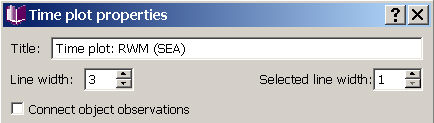
You can change the title on the window holding the time plot by typing a new one in the title box. You can alter the line width, and the width of selected lines, and choose whether to connect observations for the same location over time. The effect of connecting observations is easiest to see if you select one location prior to clicking this option - then hit "apply" at the bottom of the box, and if you like the effect, keep the box checked when you click "ok" to close the properties box.
Labels
You can alter the text on the labels by changing the wording or the font.
Bounds
The bottom half of the Time plot properties dialog allows you to set the range of data displayed in the plot. The horizontal bound is time, and you can set the minimum and maximum dates and times displayed. In the example above, the data does not vary on the order of hours, minutes, or seconds, so a time box does not appear.
You can also specify the format for dates and times, and set the minimum and maximum values (bounds) for the vertical axis. The last two windows allow you to choose the number of tick marks and associated labels that will appear on your plot. You can try out changes to any of these options by using the Apply button, which will update the plot with out closing the properties window. When you are satisfied with your changes, click Ok.