


Histogram Properties
Once you have created a histogram, you can customize its look by choosing "Properties" from the "Graph" menu. You can change labels and titles, the number of bins and their labels, and set the vertical and horizontal bounds. For all options, you can use the "Apply" button at the bottom of the box to see how your changes will look without closing the properties dialog box.
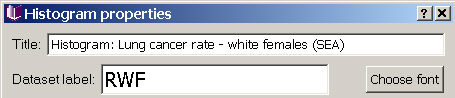
In the top section of the Histogram properties window, you can change the title on the window holding the histogram, and change the text and font of the dataset label.
Bins
The default number of bins in the histogram is the square root of the number of observations or 4, whichever is greater. You can change the number of bins in the graph and choose whether to label the bins. With a large number of bins, the labels may overlap if the histogram is small. You can drag open the histogram window to reveal the bin labels. Another option for finding out the values included in a bin is to select a bin or several bins, and then select "Show statistics for" and "Selection" in the Graph statistics window (right side of the image shown here). The minimum and maximum values in this window will now just reflect data included in the selected bins.

Vertical bound
SpaceStat will automatically select the vertical upper bound based on the peak frequency value found in your dataset (across all times). If you want more control, for example you want to create two histograms for different datasets that use the same vertical axis, check "use fixed vertical scale" and you can then specify the maximum value shown on the vertical edge. You can also change the number of labelled tick marks.

Horizontal bounds
By default, SpaceStat will automatically select the horizontal upper and lower bounds based on the minimum and maximum values found in your dataset (across all times). As with the vertical bounds, you can change this setting if you wish. First, click on the check box (see image below) to toggle it "off", and then enter new minimum and maximum values for the horizontal bounds (range of data to be plotted) of your histogram.
