


Create a variogram cloud
To create a variogram cloud, choose "  Variogram
Cloud" from the "View" menu or choose the
icon from the Visualization Toolbar. The following window
will be displayed (click on image for additional help):
Variogram
Cloud" from the "View" menu or choose the
icon from the Visualization Toolbar. The following window
will be displayed (click on image for additional help):
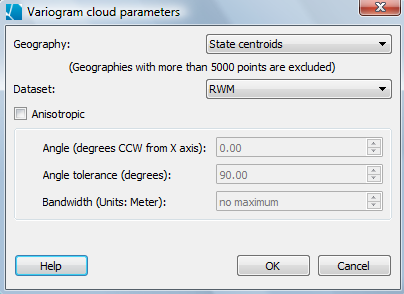
Choose the geography from the pull-down menu. Note that this method only works on point data, so you may need to create a centroid geography if you are working with polygon coverages.
Select a dataset from the list of those available.
For a plot that includes all potential pairs of locations, leave the "Anisotropic" box empty. To do anisotropic plots, see below.
Hit "OK". Your output graph will appear in a new window, and as a default the data will appear in the form of a 2D histogram (left image). The image on the right shows the same data, but "2D histogram" has not been selected in the middle row of the window heading.
Viewing the Variogram cloud as a 2D histogram vs. as a "cloud"
As the number of observations in your data set increases, the number of data pairs becomes very large and the multitude of points can hardly be distinguished on the plot. Instead of displaying all the data pairs, the variogram cloud can be discretized into a given number of cells and the density of points within each cell is then plotted (2D histogram, left figure). This option appears at the top of the variogram cloud output window, and can be toggled back and forth to facilitate comparison between points and histograms with various number of divisions. If you can't see the 2D histogram option, pull down the toolbar menu from within the variogram cloud window, and check the box next to "Graph."
Anisotropic variogram clouds
When you choose the "Anisotropic" option, the variogram cloud is calculated by classes of direction, such that only pairs of points that meet this criterion (i.e., are within a certain range of angles from one another) are included in the cloud. Specifically, each class is defined by an azimuth angle (measured counter-clockwise from the EW direction) and an angular tolerance that defines the range of directions (angular window) that are pooled together to create the graph; see Figure 1 below. For example, in 2D variogram clouds, four equally spaced directions are usually considered; e.g. directions of azimuth 0, 45, 90 and 135 with an angular tolerance of 22.5°. A maximum acceptable horizontal deviation from the direction vector can also be specified through the use of a bandwidth parameter, or this can be left at the default value of "no limit".
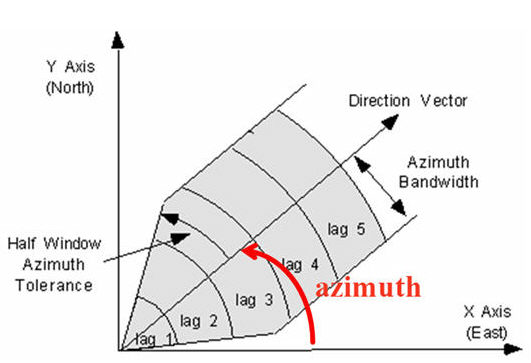
Figure 1. Graphical description of the parameters used to allocate pairs of observations to different groups in order to create an anisotropic variogram cloud.