


About Variograms
Geostatistics provides a set of statistical tools for the analysis of data distributed in space and time. It describes spatial patterns in data, incorporates multiple sources of information in the mapping of attributes, and models the spatial uncertainty and its propagation through decision-making (Goovaerts, 1997). The cornerstone of any geostatistical study is the description and the modeling of the spatial structure of the data which is quantified using the variogram.
Concept of variogram
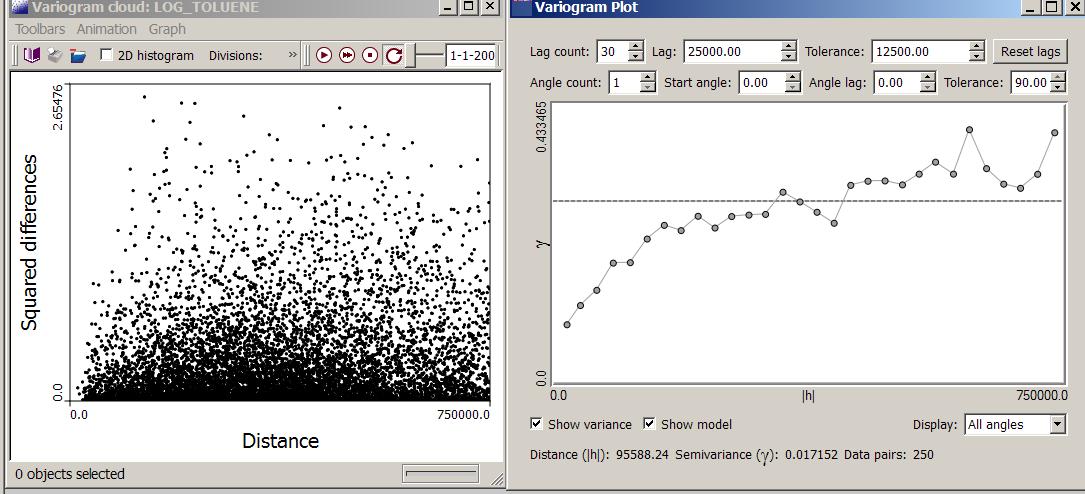
The variogram is a measure of the average dissimilarity between data as a function of their separation in geographical space. The experimental variogram can be interpreted as a discrete version of the variogram cloud: the values in the variogram cloud (i.e. half squared differences between observations) are averaged within classes of distance (called lags) and direction. Different types of averaging (i.e. variogram estimators) are available in SpaceStat. For example, the figure below shows the variogram cloud for log Toluene values computed up to a separation distance of 750,000 meters. These squared differences are assigned to 30 classes of distance (width=25,000 m) to create an omnidirectional variogram.
Following Tobler’s first law of geography (1970), ”everything is related to everything else, but near things are more related than distant things’’. Thus, in the presence of spatial autocorrelation, one should expect the variogram values to increase as the separation distance |h| increases. In most situations, the variogram will stop increasing at a given distance, called the range, which can be interpreted as the distance of dependence or the zone of influence of the attribute. The discontinuity at the origin of the variogram (i.e., at very small separation distances) is called the nugget effect and arises from measurement errors or sources of spatial variation at distances smaller than the shortest sampling interval or both.
