Ripley's K-function evaluates how many other disease cases are within a specified distance (h) from each case in turn. If a case is on the edge of the study area, then there will be parts of that distance without data. Instead of no cases in the area outside of R, it should instead be interpreted as no data at all.
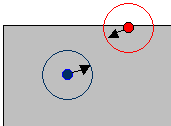
For example, a section of a larger gray study area is illustrated below. The edge of the study area is the thin black line. The red point sits at the edge of the study. The circle of radius h around it is partly outside the study, while the circle around the blue point is fully inside the study area. Data on these two points is not entirely comparable.

A weighting factor corrects for this. The formula for K(h) divides the case count around a particular region by a weight, wij. This weight is the conditional probability that points around i will be in the study area. ClusterSeer calculates the weight as the proportion of the circle's area that lies in the study area.
The entire blue circle is within the study area. That weight is 1. About half of the red circle is outside the study area, so the weight for cases within the red circle is 0.5. The case count in that area is divided by 0.5, essentially doubling the cases to account for the missing half of the circle.