P-values
P-values, short for probability values, provide an estimate of how unusual the observed values are. The P-value of a test statistic can be obtained by comparing the test statistic to its expected distribution under the null hypothesis (the null distribution).
The interpretation of a test statistic balances the possibility of two types of errors. Declaring whether a P-value is statistically significant involves choosing the level of error with which you are comfortable. Alpha provides the threshold for significance. If the P-value for the observed value falls below alpha, then the observation is termed significant.
|
concept
|
symbol or formula
|
meaning
|
|
type I error
|
 , alpha (also called significance level) , alpha (also called significance level)
|
the probability of rejecting the null hypothesis when it is true
|
|
type II error
|
 , beta , beta
|
the probability of accepting the null hypothesis when it is false
|
|
statistical power
|
1 -
|
the power of a test indicates its ability to reject the null hypothesis when it is false
|
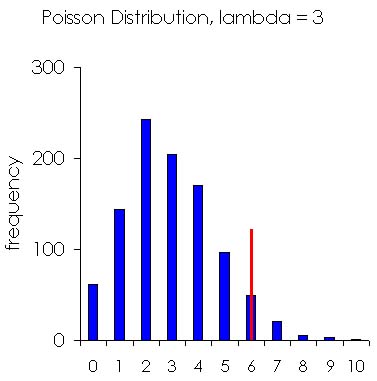
P = 0.05 is the traditional alpha level, which can be interpreted to mean that results that are more extreme would occur by chance less than 5% of the time, if the null hypothesis were true. The figure below graphs 1,000 Poisson random numbers (lambda = 3). The red line illustrates the P = 0.05 alpha level for a one-tailed test. The P-value is less than alpha when the test statistic is higher than the cutoff. In that case, it is customary to reject the null hypothesis and accept an alternative hypothesis, that there is clustering.
Most ClusterSeer methods are one-tailed, focusing on the upper-tail of the distribution. They test whether the test statistic is higher than expected. Two-tailed tests evaluate whether the statistic diverges from a central value, and the alpha level is divided between the two tails of the distribution.
