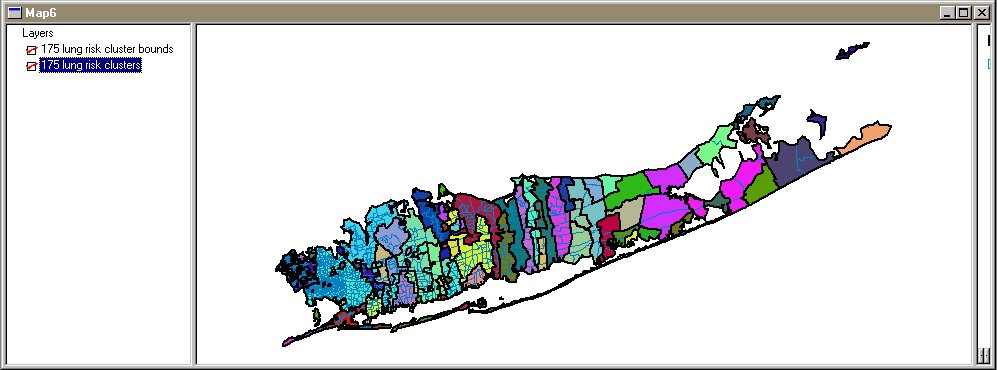
In the map (pictured below) you will see the 175 clusters (colored areas) and the cluster boundaries (thick lines). Within the clusters, you can see the boundaries of the original ZIP codes that compose the clusters. The colors on this graph are arbitrary, they do not indicate distance in variable space or have any meaning other than to distinguish clusters from one another.
![]()