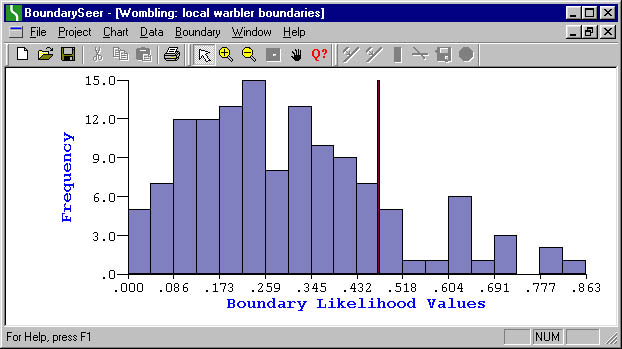
The histogram shows the distribution of Boundary Likelihood Values (BLVs) for the dataset and the threshold you set. Remember the BMV cutoff is the top 17% of all BLVs, so 83% of the BLVs are below the threshold (illustrated as a slim red line).