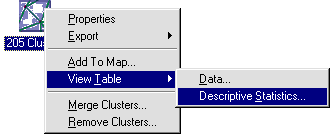
To view a table of the cluster statistics, go to "Table" under the project menu and choose to view a table of "205 Clusters" type: "Cluster statistics." Alternatively, right click on the "205 Clusters" dataset in the Data tab of the Project Window and choose View Table > Descriptive statistics.

Sort the table by the number of elements (number of data points in the cluster). To do this, hit the Total Elements column header, the table will sort according to that column. One cluster (#8) has most of the elements, with the other clusters having much fewer. If you sort by the number of cases/1000, you can see that there is wide variation in the cases/1000 among the clusters (from 0.0093-66.0 cases/1000).
The answer to question 1 is YES, there is variation in the pattern of cases in these counties.