For numeric data, BoundarySeer includes four possible measures of dissimilarity: Euclidean distance, squared Euclidean distance, Manhattan distance, and the Steinhaus Coefficient of Similarity. Mismatch value is the only choice for categorical data in this version of BoundarySeer.
In the equations below, p represents the number of variables, ![]() is the value of variable i at the first location, and
is the value of variable i at the first location, and ![]() is the value of the variable i at the second location.
is the value of the variable i at the second location.
Euclidean Distance. This metric represents the straight-line distance between observations in variable space, and is the most commonly used metric in many disciplines.
![]()
Squared Euclidean Distance. This metric is simply the Euclidean Distance squared, and will give you the same results in terms of boundary delineation as the Euclidean Distance. We include this metric because if you have very large data sets, the processing time can be lower if the program does not have to calculate the square root for Euclidean Distance.
Manhattan Distance. This metric, which is also called the city block metric or taxicab metric, estimates distance as the sum of the differences between values of each variable at two locations.
![]()
Steinhaus (also referred to as Bray and Curtis - below, we present the equation typically attributed to Bray and Curtis). This metric is designed and recommended for use with count data, and is a self-normalizing metric. Since the metric is self-normalizing (e.g., it accounts for differences in the range of count values), data need not be standardized prior to its use.
For clustering, it can be used as a similarity metric with a slightly different formula.
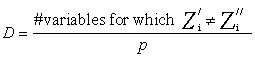
Mismatch value is the only available metric for categorical data. The mismatch value is calculated simply as the number of variables for which the two locations have different values (mismatches), divided by the total number of variables.