Maps are visual representations of data, of the spatial distribution of values constructed from the data (e.g., spatial networks, boundary elements), or of the results of analyses.
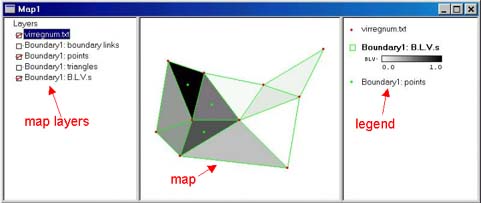
BoundarySeer maps are displayed in a three-pane window. The left-hand window lists the active layers in the map. The center window contains the map itself. The right-hand window shows the map legend, including the symbols used and the key. Only the center and right panels are exported and only the center panel can be printed.
The map layers panel lists all the map layers in the project. To expand the frame and view the full layer names, drag the line between the layer names and the map itself.
You may show or hide a map layer by checking or clearing its associated box using the mouse. Displayed layers have a red check in the box next to their name.
The active layer, the one that is queried with the query tool, is highlighted on the layers list. You can change the active layer by clicking on its name in the layer list.
To change the order of layers on a map, drag layers up or down the list.
The maps are drawn sequentially, with layers higher on the list overtopping those lower on the list. For instance, if you have a polygon layer it may obscure a line layer underneath it. To fix this, change the order of layers in the layer list.
The legend identifies the symbols on the map. Only active map layers appear on the legend panel.
See also: