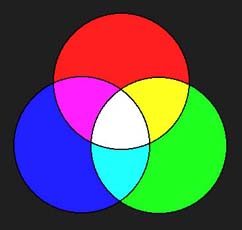
 Red plus Green plus Blue = White
Color composite maps display the values of up to three variables at one time. You can make color composite polygon and raster map layers in BoundarySeer. In color composites, each variable is displayed as gradations of a single color, red, green, or blue. Interpreting these maps is straightforward, once you realize the basic principles of combining colors of light.
Red plus Green plus Blue = WhiteRecall your high school physics unit on light wavelengths. White light consists of all wavelengths of light together, while the absence of light is darkness, black. Thus, gradations of color in color composite maps go from dark (low values of all three variables) to light (high values of all three variables).
Areas in a "pure" color (red, green, or blue) have high values of only one variable and low values of the other two, while white areas have high values of all variables, and black areas are low in all.
Magenta is a mixture of red and blue, with low values of the green variable; yellow is high green and red, with low values of blue; and cyan is high green, high blue, low red. Query the map to view the values of each variable.
See also: