|
Ho |
The null spatial model is an inhomogeneous Poisson point process with an intensity, |
|
Ha |
In some locations in the multidimensional space, the number of cases exceeds that predicted under the null model. |
|
For the space-time scan, a cylindrical window is moved systematically through the study's geographic and temporal space. The window is centered on an individual region centroid at a particular time and expanded to include neighboring regions and time intervals until it reaches a maximum size. The number of cases observed and expected within the window is calculated at each window size for each centroid. The maximum size will not exceed 50% of the total population-at-risk size for the study period and 50% of the study period span.
For the space scan, a circular window is moved systematically through the study's geographic space. First, contiguous polygons for ego are determined. These polygons are then ordered from first to last based on closest to farthest distances between centroids. For subsequent layers, contiguous polygons are ordered from first to last using the same method. The process continues until no more polygons are available. The maximum size of each window will not exceed 50% of the total population-at-risk size for the study period.
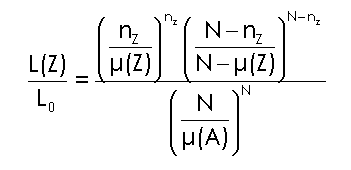
The hypotheses are evaluated with a maximum likelihood ratio test that examines whether the null or alternative model better fits the data (notation follows Kulldorff 1999). The scan statistic is the maximum likelihood ratio over all possible window sizes. Its P-value is obtained through Monte Carlo randomization based on a multinomial randomization. If the null hypothesis is rejected, ClusterSeer reports the spatial or spatio-temporal location and the extent of the cluster that caused the rejection.
The likelihood ratio is

if nZ > ![]() , 1/L0 otherwise
, 1/L0 otherwise
Where nz is the observed number of cases and ![]() is the expected number of cases in cylinder Z. The observed (N) and expected [
is the expected number of cases in cylinder Z. The observed (N) and expected [![]() ] number of cases are calculated over the entire study area, across all time periods.
] number of cases are calculated over the entire study area, across all time periods.